There may be instances where you may wish to see the current status of the JMS connection factories. You can view reports on historical pending messages as well as view the counter report.
Monitoring JMS Connection Factory
To view reports on a JMS connection factory:
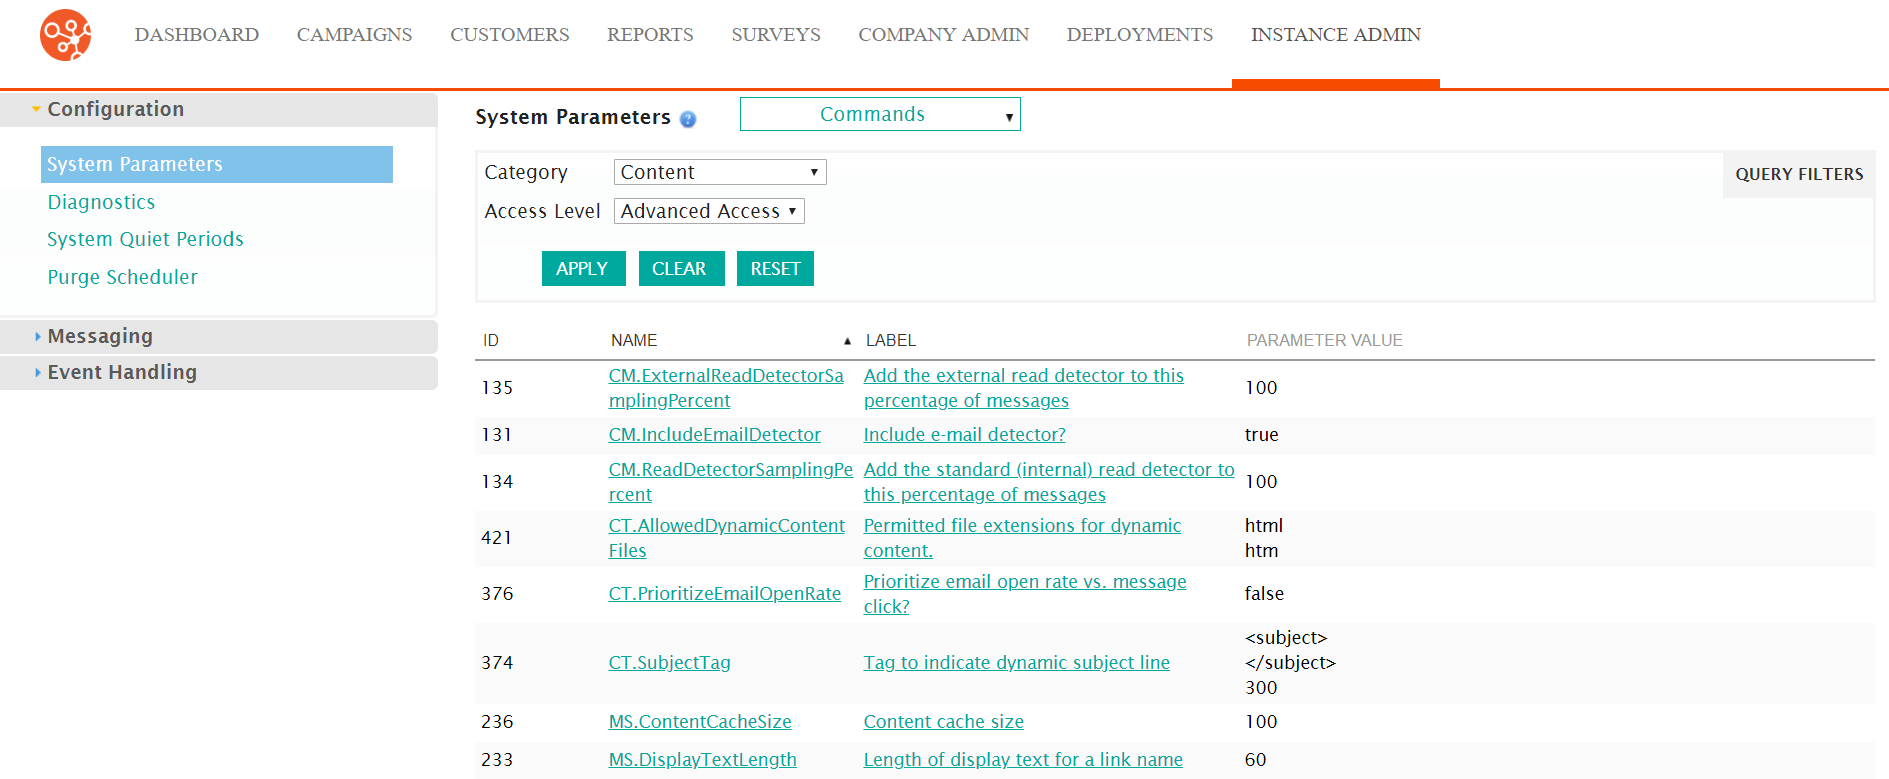
- Navigate to the Instance Admin screen. The System Parameters
screen displays.
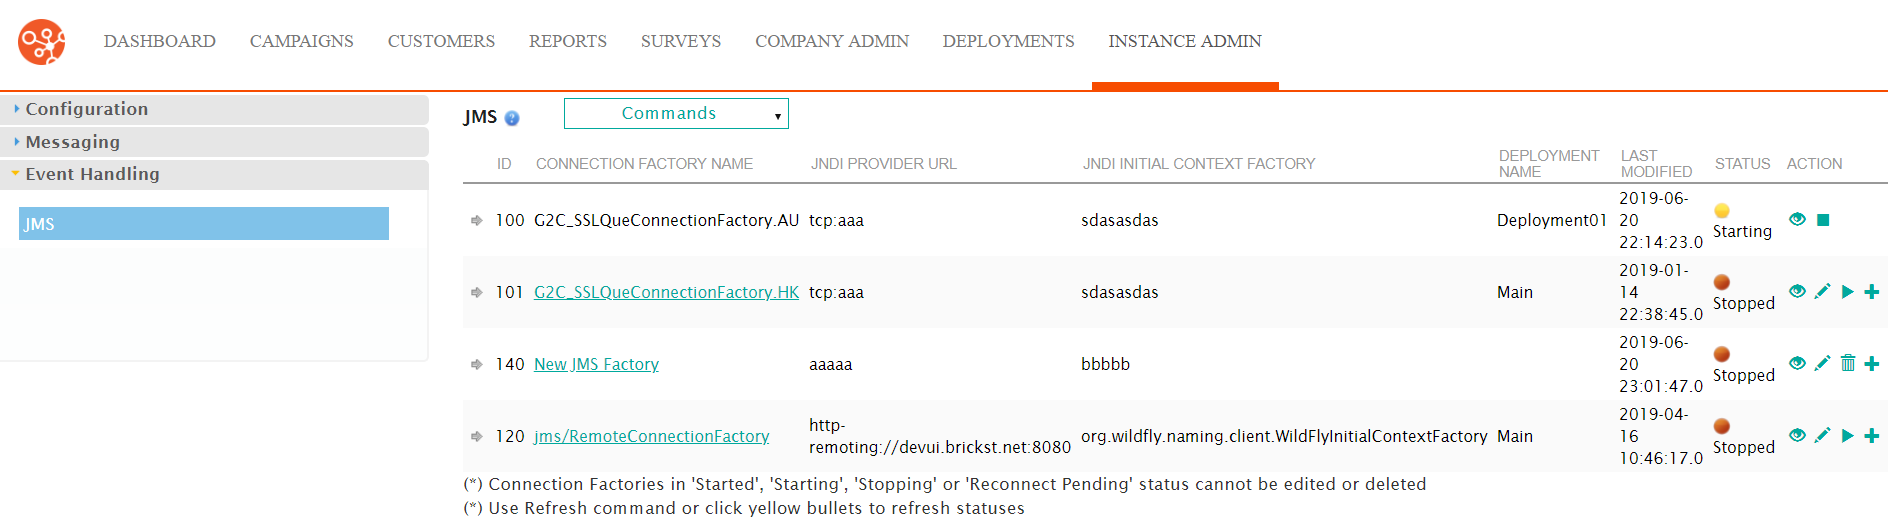
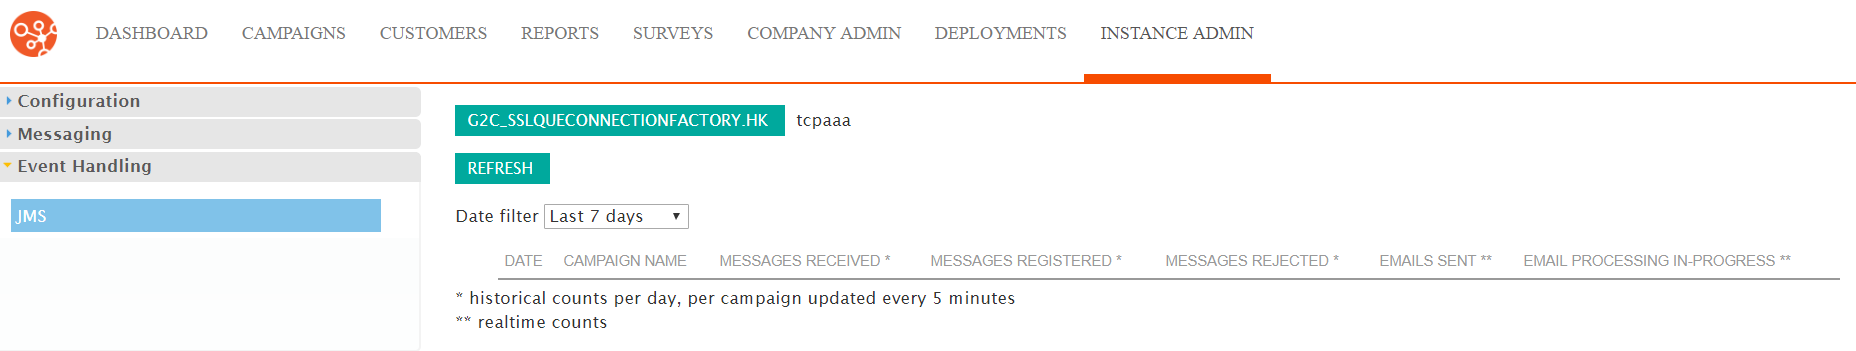
- Click on the Event Handling sub-menu in the menu bar on the left,
followed by the JMS menu option. The JMS screen
appears.
- Click on the Monitor icon (
 ) beside the desired connection factory. The
Monitoring screen appears.
) beside the desired connection factory. The
Monitoring screen appears.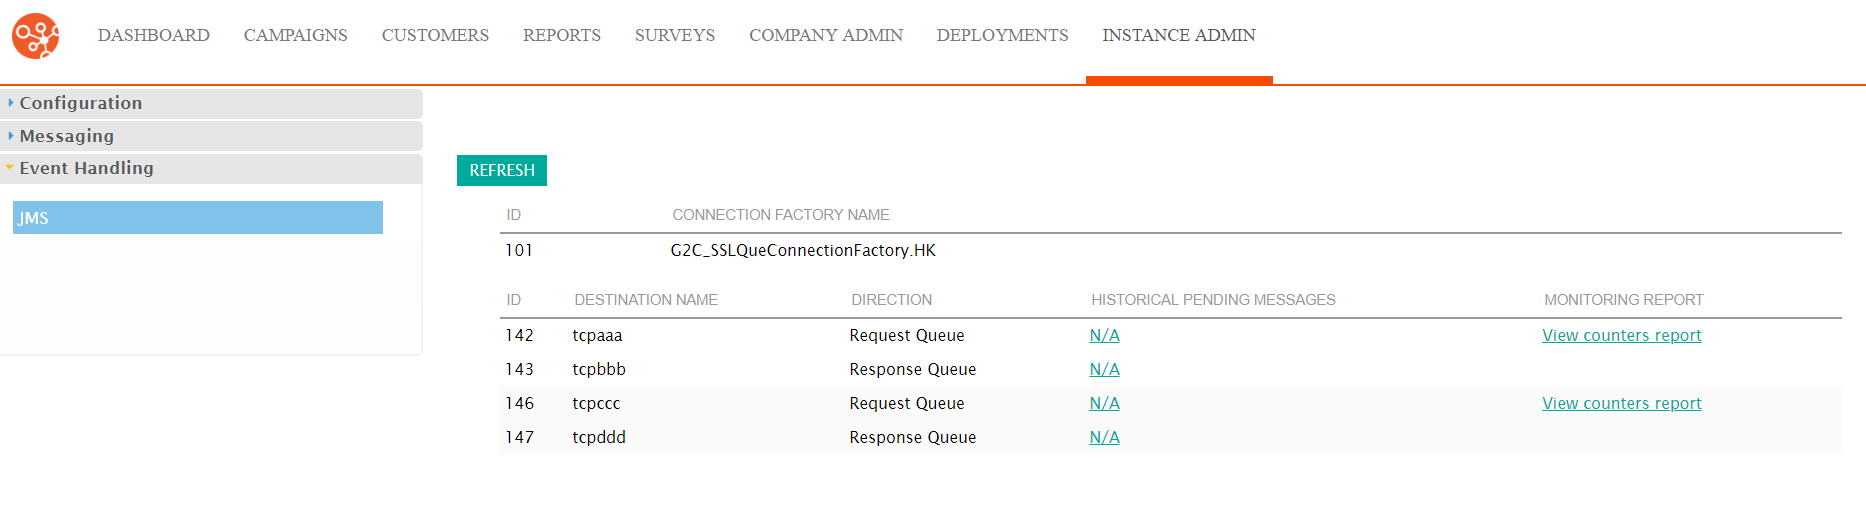
- To refresh the results, click the Refresh button.
- To view the Historical Pending Messages report:
- Click on the Historical Pending Messages name link. The Pending
Queue Messages report displays.
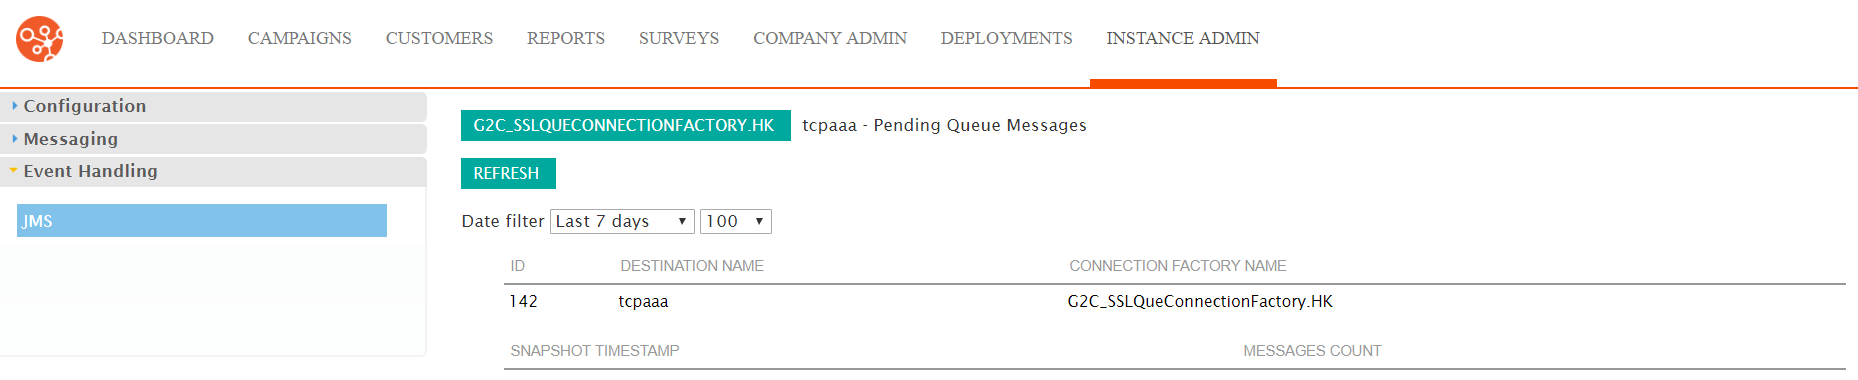
- Select the desired date range from the Date Filter dropdown.
- Select the desired number of results from the number dropdown.
- Click the Refresh button to refresh the results.
- Click the [JMS Connection Factory Name] button to return to the Monitoring screen.
- Click on the Historical Pending Messages name link. The Pending
Queue Messages report displays.
- To view the monitoring or counters report:
- Click the monitoring report name link for the desired destination.
The Counters report displays.
- Select the desired date range from the Date Filter dropdown.
- Click the Refresh button to refresh the results.
- Click the [JMS Connection Factory Name] button to return to the Monitoring screen.
- Click the monitoring report name link for the desired destination.
The Counters report displays.
- Click the JMS sub-menu heading in the left-side panel to return to the JMS screen.