You are able to add elements to the Real Time Monitor screen to customize and tailor your dashboard to display the information that is important to you.
Adding an Element to the Monitor
To add an element to the real time monitor:
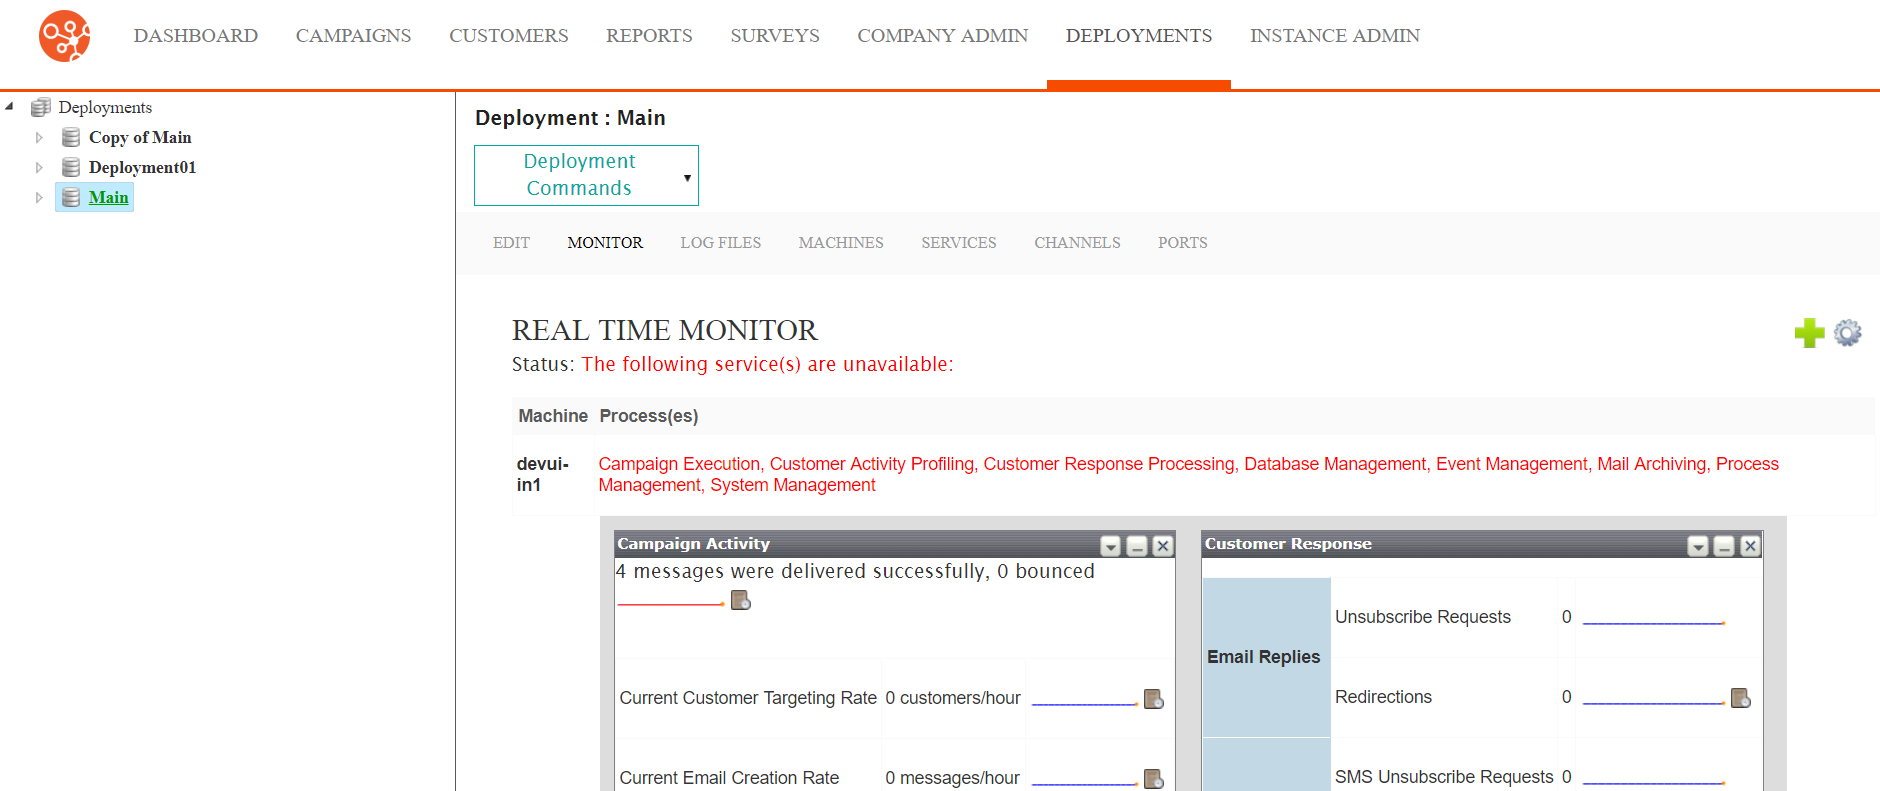
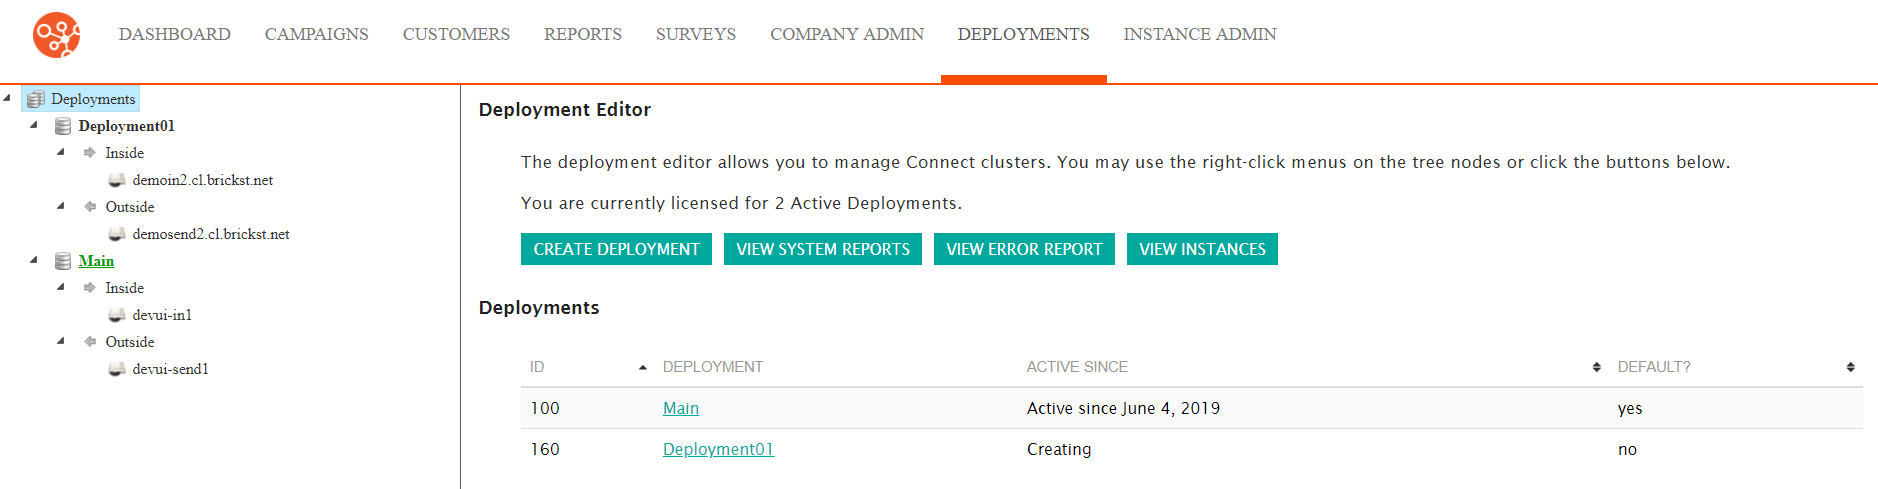
- Navigate to the Deployments screen. The Deployment Editor
screen displays.
- Click on the desired active deployment. The real time monitor
displays.
- Drag and drop the '
 icon onto the dashboard into the desired column
to add a reporting widget to the dashboard.
icon onto the dashboard into the desired column
to add a reporting widget to the dashboard.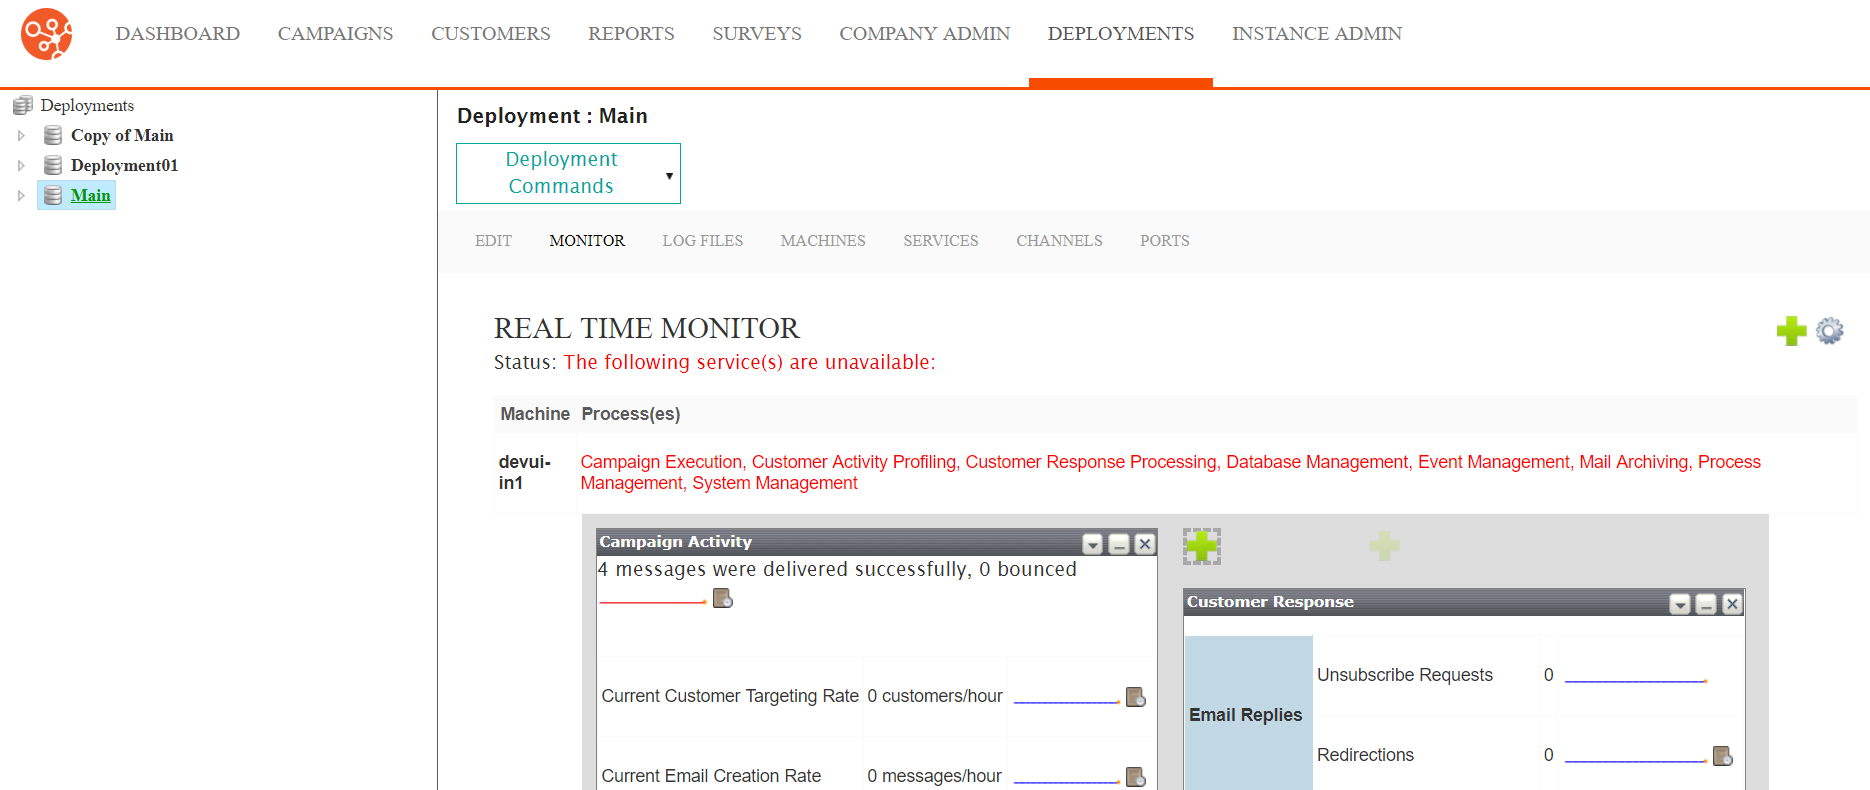
Once in position, the widget tile details displays.
- Enter the details for the widget:
- Title: The displayed title for the widget
- Description: The description for the widget
- Type: The type of widget to be displayed. Each of the
different widget types will require different information for
appropriate display
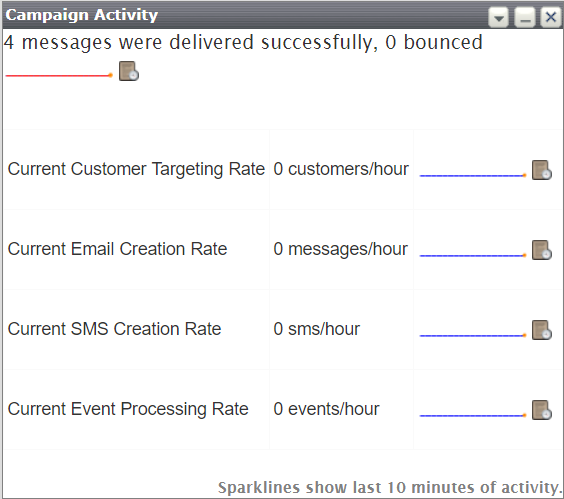
- Campaign Activity: Displays successful delivery rates
of messages to customers
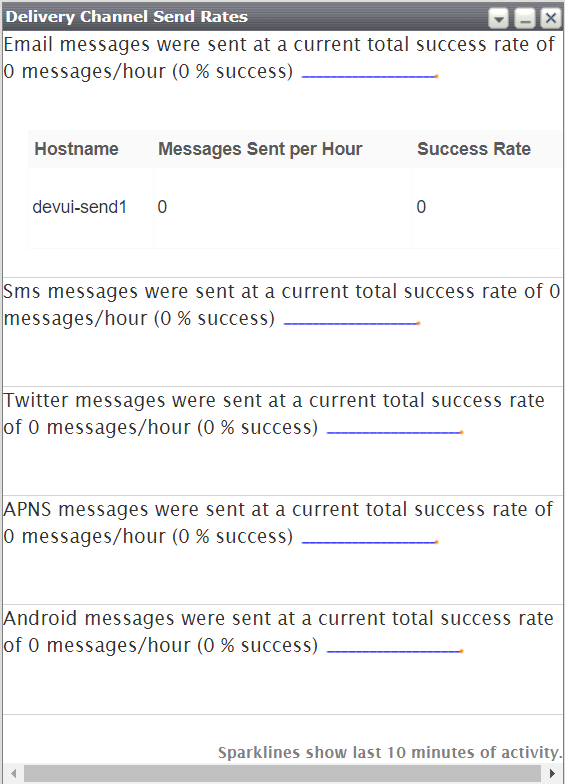
- Delivery Channel Send Rates: Reports on the success
rates of message delivery
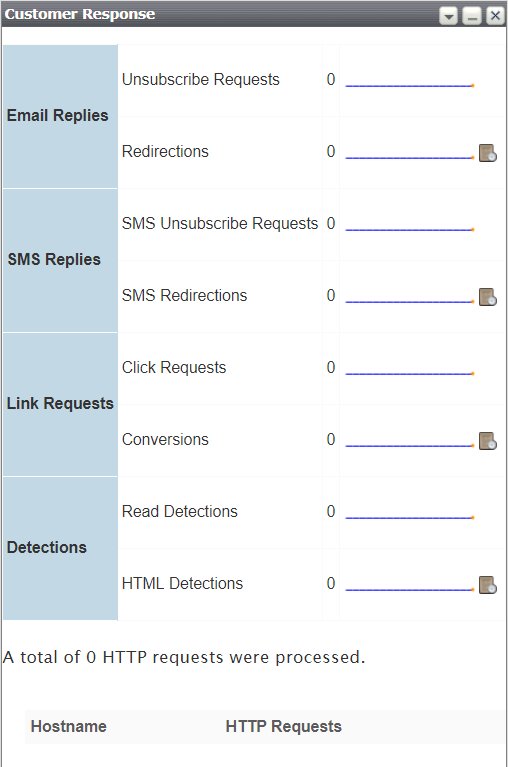
- Customer Response: Reports on the number of customer
responses to messages
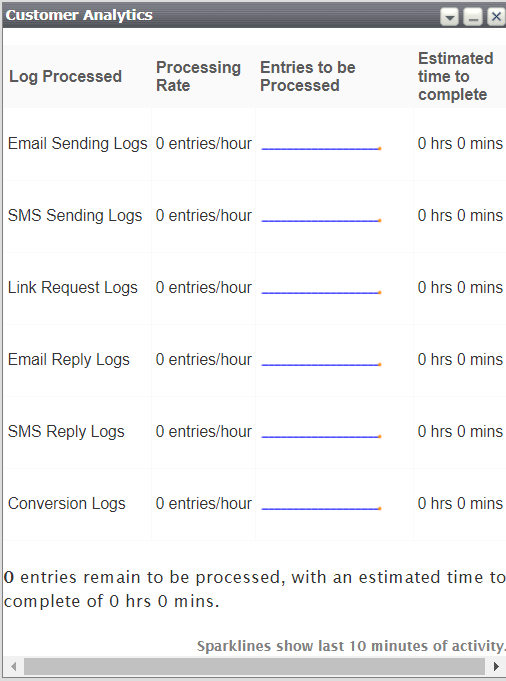
- Customer Analytics: Reports on delivery times and
rates of messages
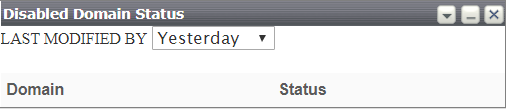
- Disabled Domain Status: Reports on the status of any
disabled domains
- Campaign Activity: Displays successful delivery rates
of messages to customers
- Refresh Interval: The amount of time between data refreshes (in seconds)
- To cancel without saving the widget, click the Cancel button.
The monitor displays, the widget is not saved or displayed.
- Click the Save button.
The monitor displays with the new widget added to the dashboard.