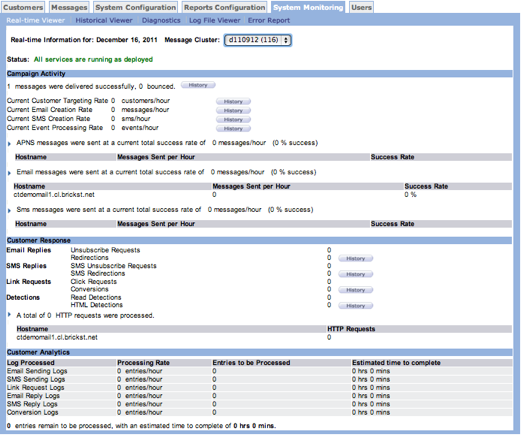
The Real Time Viewer displays the current system performance. It displays current throughput and critical measurements of key system components. This is the default screen that appears in the System Monitoring tab.
Screen Top
The top part of the screen displays two important pieces of information:
Message Cluster - A system assigned identifier for the Connect actions and processing associated with a campaign.
Status - Provides the current overall status of the system.
Campaign Activity
This section displays the number of messages delivered and bounced, as well as the customer targeting rate, e-mail creation rate, and event processing rate.
The successfully delivered messages number include messages delivered on the first attempt as well as those delivered on retry.
Customer Targeting Rate - Current estimated customers targeted per hour based on the previous 15 minutes activity. The default is 15 minutes and can be changed in System Parameters.
E-mail Creation Rate - Current estimated messages created per hour based on the previous 15 minutes activit. The default is 15 minutes and can be changed in System Parameters.
Event Processing Rate - Current events per hour based on the previous 15 minutes activity. The default is 15 minutes and can be changed in System Parameters.
Click the History button for more information about each rate.
Messages were sent at a current total success rate of ___ messages per hour ( __% success) - Success ratio for the first attempt. It does not include retries.
Hostname - Email server name.
Messages Sent - Number of messages sent for each email server.
Success Rate - Success rate of each email server.
Customer Response
This section displays customer reply, click-through, and conversion data.
- Unsubscribe Requests - Number of replies received with unsubscribe requests.
- Redirections - Number of redirection replies.
- Click Requests - Number of customer clicks on the combined links of all messages.
- Conversions - Number of conversions among the link requests received.
- Read Detections - Number of read detections processed. A read detection is processed each time a customer opens a message.
- HTML detections - Number of HTML detections processed. An HTML detection is processed each time a customer opens a message with an e-mail client that can process HTML content.
Click the History button for more information about each rate.
- Hostname - Server name that processed the requests.
- Requests - Number of requests processed by each server.
Customer Analytics
This section provides estimated real-time processing rates and time-to-complete estimates:
- Email Sending Logs
- SMS Sending Logs
- Link Request Logs
- Email Reply Logs
- SMS Reply Logs
- Conversion Logs
Processing Rate - Displays the current entries-per-hour processing rate for each log.
Entries to be Processed - Displays the current number of entries pending processing for each log
Estimated time to complete - Displays the estimated time in hours and minutes for each log’s pending processes.