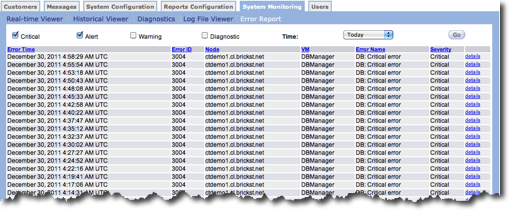
The Error Report option in the System Monitoring tab displays a list of error reports that meet the criteria you select.
Follow these directions to create a custom error report.
- In the section above the report table, click one or more of the error types. The
options include:
- Critical
- Alert
- Warning
- Diagnostic
- In the Time field, select the the time period for the report. The options include:
- Today
- Yesterday
- Last 3 Days
- This Week
- Last 7 Days
- Last 30 Days
- Click the Go button. The report appears in the table below.
You can sort the table by clicking a column heading. The columns in the table include the following:
- Error Time - Data and time of day when the error occurred.
- Error ID - ID for each error.
- Node ID - Cluster node where the error occurred.
- VM ID - Virtual machine where the error occurred.
- Error Name - Name of each error.
- Severity - Severity level for the error.
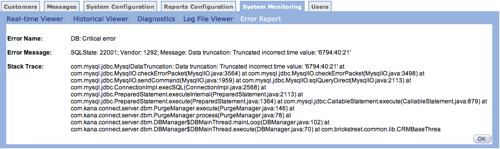
To view the details for any entry in the table, click the details link. A new window appears with the error details. Click OK to close the detailed report and go back to the error report page.